Introduction
In 2019, I joined Paychex as a UX designer to work on Paychex Flex - an all-in-one HR software and service solution that covers Payroll, Human Resources, and other areas. To help you better understand what we've done, here's a short video that puts you in the shoes of a typical user.
During my three years adventure at Paychex, I have contributed to designing over ten products spanning five swimlanes. In the following, I want to share my design process and thinking for a corporate compliance product I was involved in.
Stay EEO Compliant
Equal Employment Opportunity (EEO) is a critical federal law that protects employees from discriminatory practices based on their race, gender, and other factors. To ensure that the law is enforced, the government established the EEO Commission (EEOC), which requires eligible companies to submit annual reports containing employee demographic information.
In order to aid companies in maintaining compliance with this regulation, Paychex Flex developed the EEO reporting assistance product. As the sole designer, I took charge of implementing the MVP and designing subsequent iterations.
Illustration from dgs.ca.gov
Understand the requirements
When I initially joined the project, things were pretty chaotic. The ex-designer made a preliminary version of the MVP but was set to leave Paychex for a new opportunity. Meanwhile, the development team was under immense pressure to start soon in order to meet a strict deadline. I understood that I needed to act fast to comprehend the requirements.
Upon researching EEO on Google, I visited EEOC.gov and carefully read all the instructions and documents provided. However, the papers there were difficult to understand, and I had to seek help from our PO and BA to gain a thorough understanding. The process was quite challenging, and it took me two weeks before I could fully understand the situation in meetings.
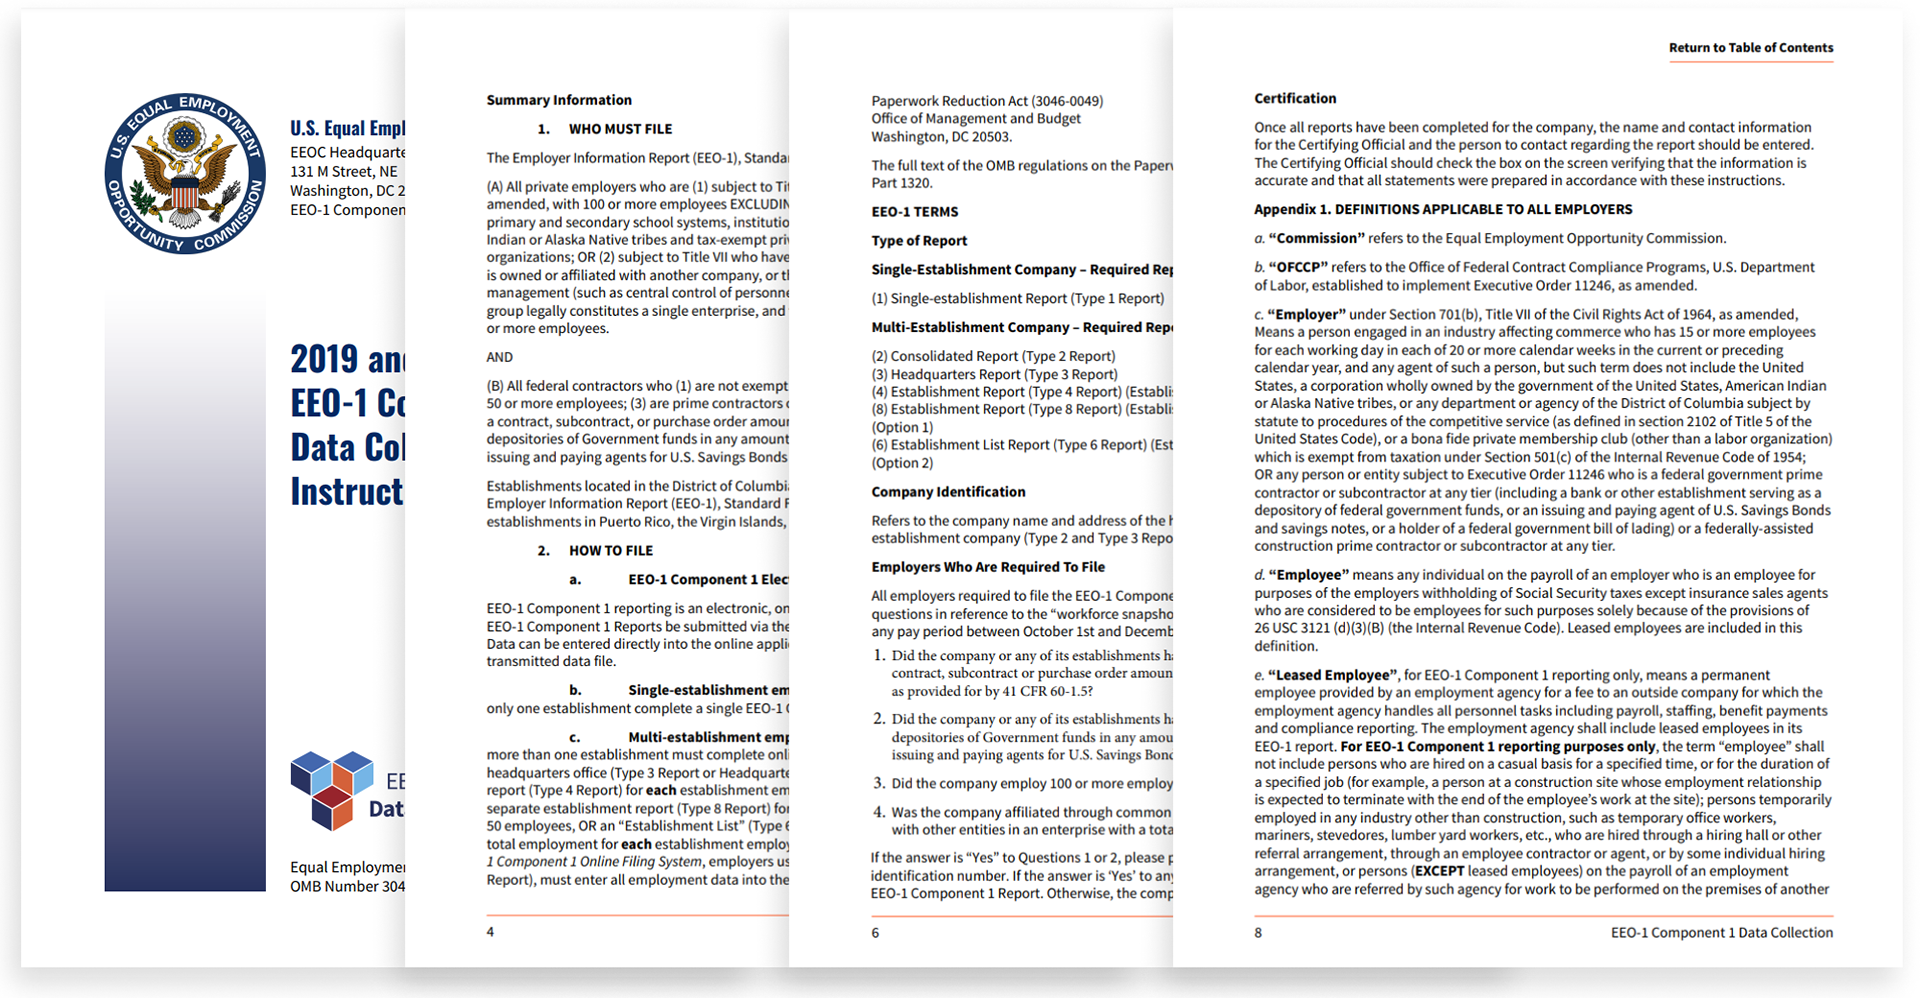
2019 and 2020 EEO-1 Component 1 Data Collection Instruction Booklet, EEOC
Simply saying, the EEO-1 report is the most critical annual requirement for employers. It collects basic information about a company and its employment data, such as gender and race/ethnicity, and organizes it by various EEO job categories. While it may seem straightforward, filling out the report can be a complex task that requires careful attention to detail to ensure the report is correctly formatted and calculated.
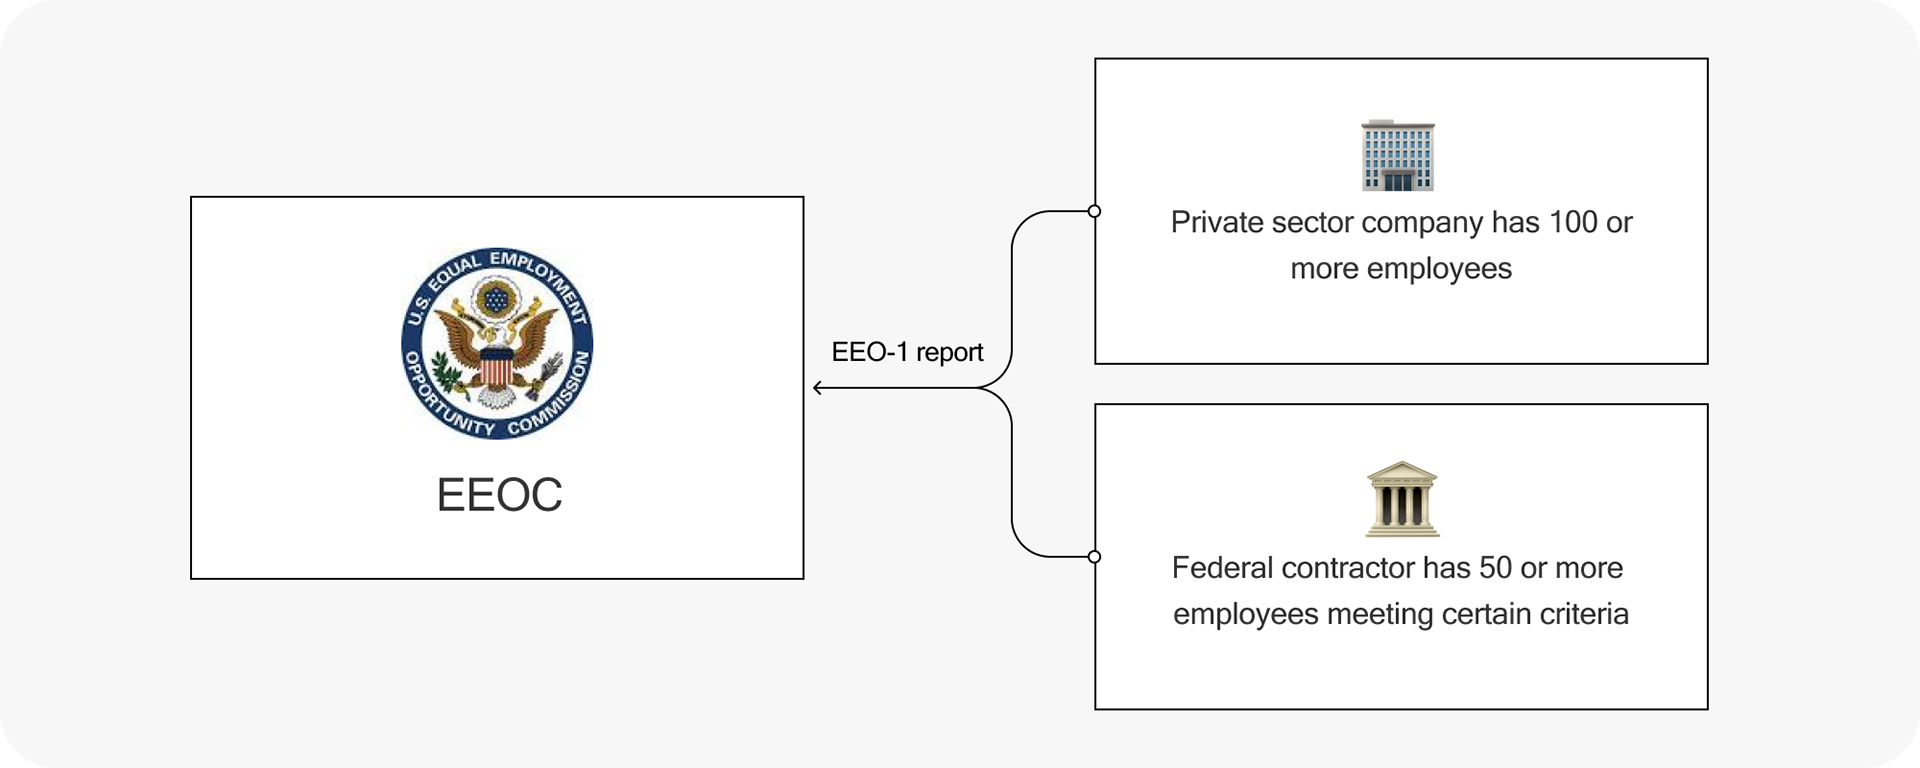
Main eligible companies for the EEO-1 report
Think about the users
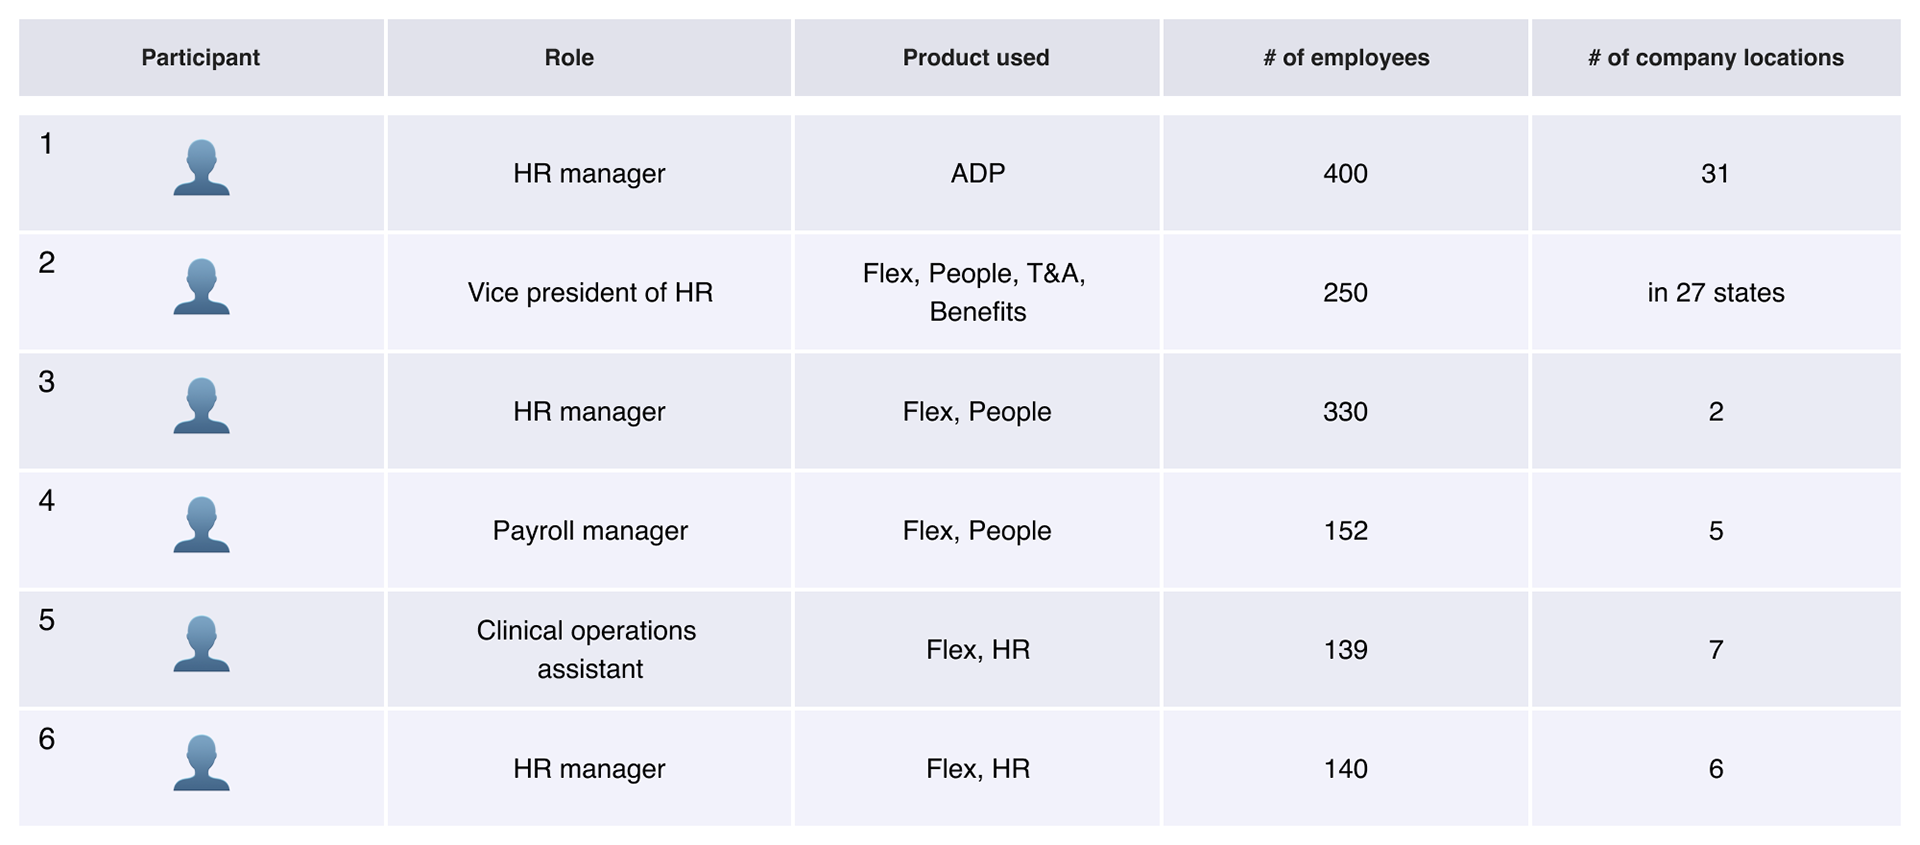
How difficult is it to complete the EEO-1 report? To find out, I started by reviewing a user research report from our UX research team. This research interviewed 11 participants from different companies in various positions, but all have experience handling compliance requirements like EEO and OSHA for their companies. The researcher asked how they prepared for the EEO reporting, their working process, and summarized their pain points.
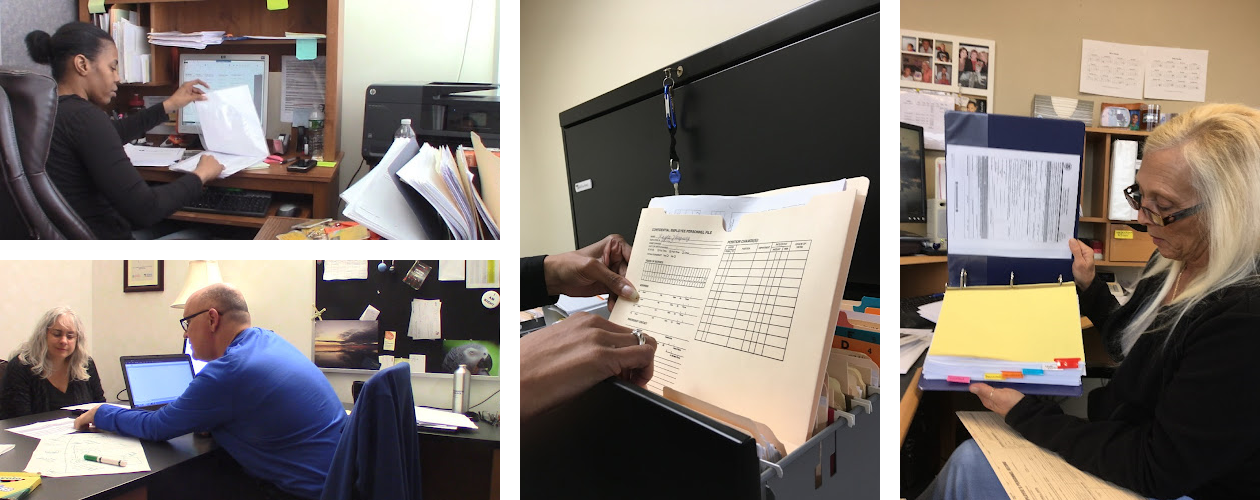
Participants shared their experience in the interview
Based on the report, the majority of participants indicated that the annually EEO-1 reporting is a highly stressful task. To begin the process, participants reported having to read through numerous instructions and download the sample form on the EEOC website. Upon opening the form, participants are immediately confronted with the following:
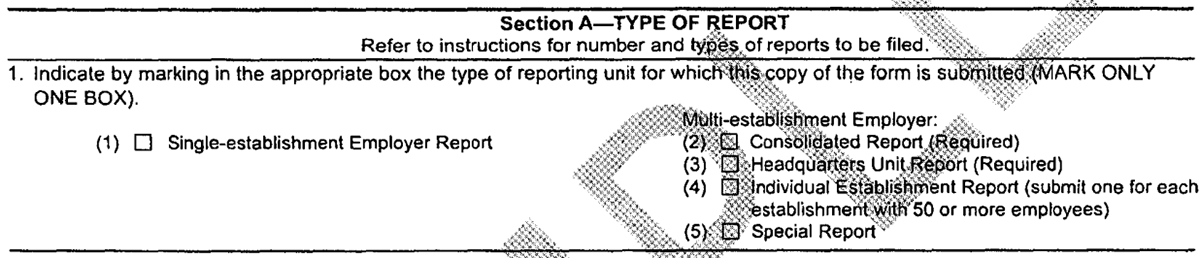
Section A - EEO-1 Sample form, EEOC
If their company has only one location, this process will be much easier. But if their company is multi-establishment and has multiple locations, they'll need to submit a consolidated report, a headquarters report, and a set of individual establishment reports for every location, which could be a lot. Keep scrolling through the sample form, they will see this awful table:

Section D - EEO-1 Sample form, EEOC
This is the most meaningful data table in the form, includes columns for gender and race/ethnicity and rows for EEO job categories. Since many companies do not have a complete information collection mechanism, they need to check for missing data when filling out this table. They may also need to send an EEO survey to all employees. In addition, they need to carefully study and calculate to ensure that the numbers in each cell are correct.
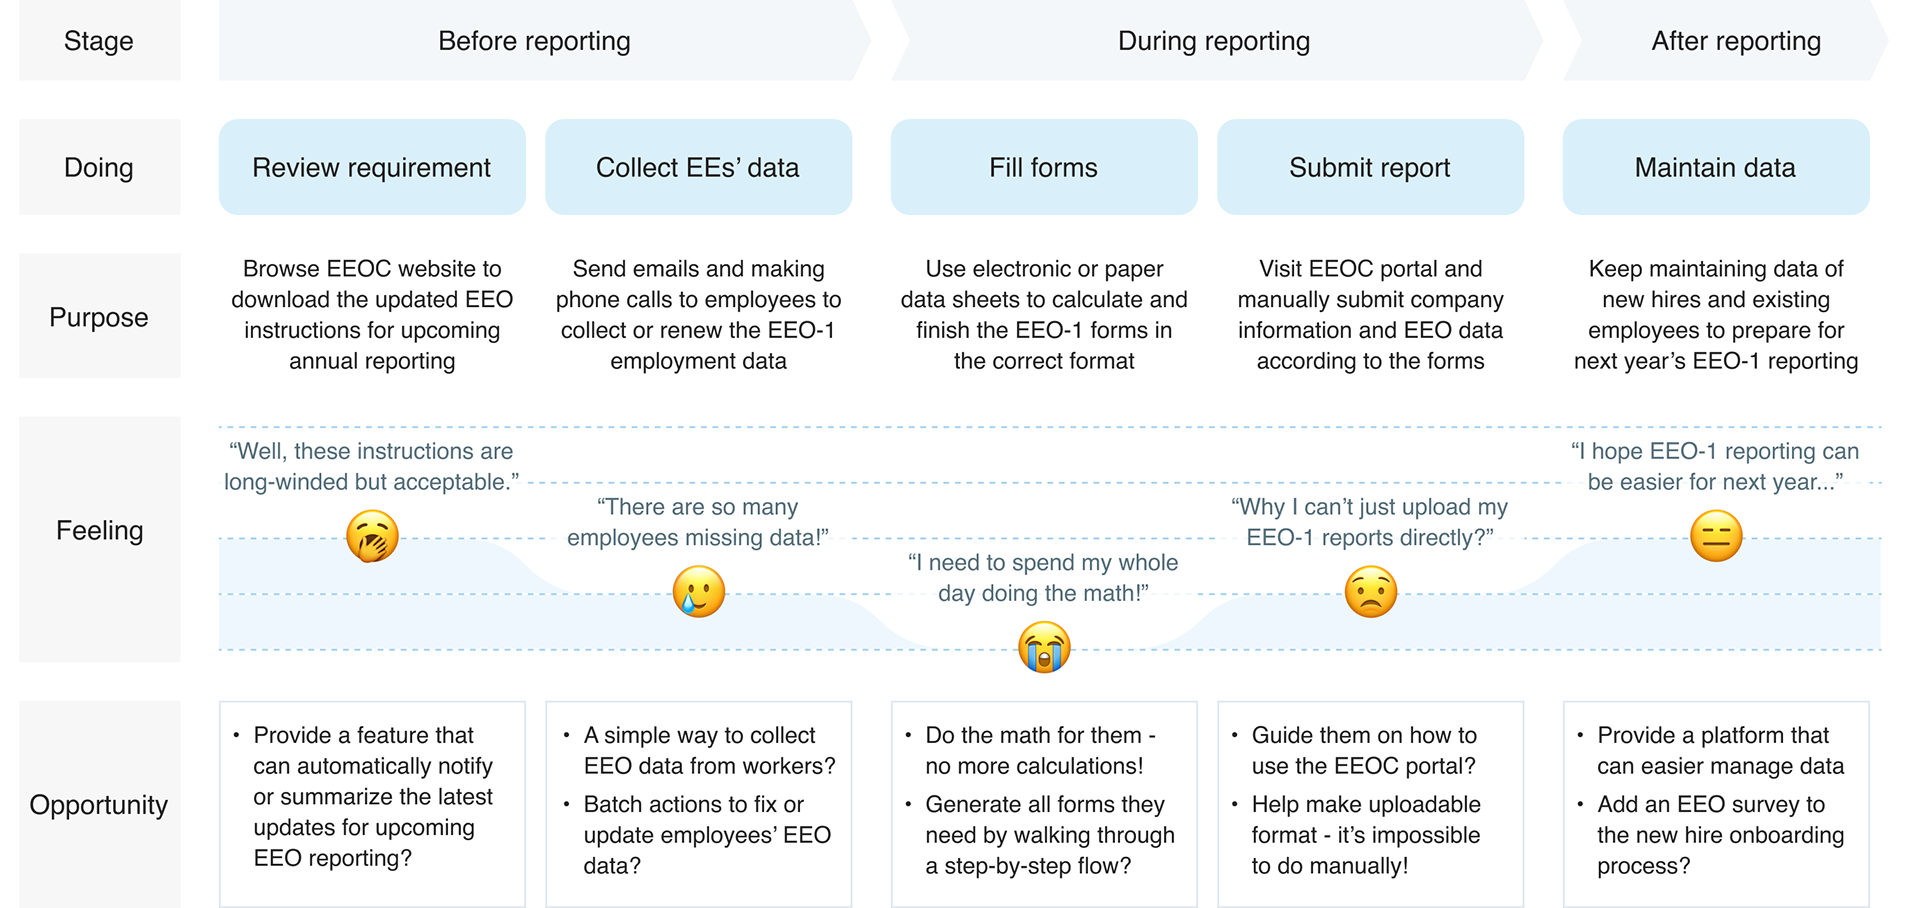
Don't forget that if they own multiple locations, they need to perform the same operation for each. Also, because this is just a sample form, participants need to visit the EEOC portal and manually enter all the information. Finally, they will only end up exhausted. Based on the what I learned, I made the following UX journey map to see the flow and our opportunities better:
Know the MVP
Our project team understood how bad the experience of EEO-1 reporting is and wanted to help our users with data collecting and form filling as the starting point. When I came on board, we had an initial MVP vision for streamlining these difficult tasks. At this stage, I refined and improved the vision based on my knowledge of the Paychex design system, and provided strong support to the development team so that they could start the sprint as soon as possible.
In the EEO-1 employment data card, users can see how many employees are missing information and send a quick survey to collect those missing data. They can also manually manage their employees' EEO data in a detailed, drillable list view.
Once all missing information has been filled in, users can generate EEO-1 employment data reports by type based on their criteria in a few minutes, saving them the effort of manual calculations.
The MVP met our short-term goal, but it still has many defects. While working on the design deliverables, I discussed the issues I discovered with our PO. For instance, the MVP does not support batch assignment of job categories, which means users have to assign them one by one. Moreover, it does not create uploadable format reports, so users still need to understand the provided information and fill out the forms correctly on EEOC.gov.
Fortunately, the PO also identified these issues, and we quickly agreed on the necessary improvements. However, before making any further plans or designs, we consulted with our UX research team and conducted user testing to evaluate the MVP's performance and identify any missed opportunities for improvement.
Initial user testing
While our developers focused on the software architecture, we teamed up with our research colleagues to incorporate EEO-1 reporting as a testing scenario in our most recent usability study. The study was conducted remotely with six HR administrators, who shared their screens and provided audio commentary while interacting with the prototype.
As a result, we received positive feedback from participants on the flow to edit EEO missing data to create an EEO-1 report, with all participants stating that they would likely use the EEO reporting feature. However, the study also highlighted some issues - Half of the participants had difficulty locating the feature, and some participants questioned the feasibility of importing their data. Moreover, most participants wanted to receive the report immediately after completing the creation.
Plan the future
After user testing, I worked with the team and planned two future phases to solve related issues:
Phase 1: Feature improvement
In this phase, we focus on adding missing functionalities to our MVP framework. Based on feedback from user testing and our understanding, we plan to add data import, job category batch assign, and the capability to generate uploadable formats. They cover different scenarios, but all of them will bring efficiency improvements for users.
In this phase, we focus on adding missing functionalities to our MVP framework. Based on feedback from user testing and our understanding, we plan to add data import, job category batch assign, and the capability to generate uploadable formats. They cover different scenarios, but all of them will bring efficiency improvements for users.
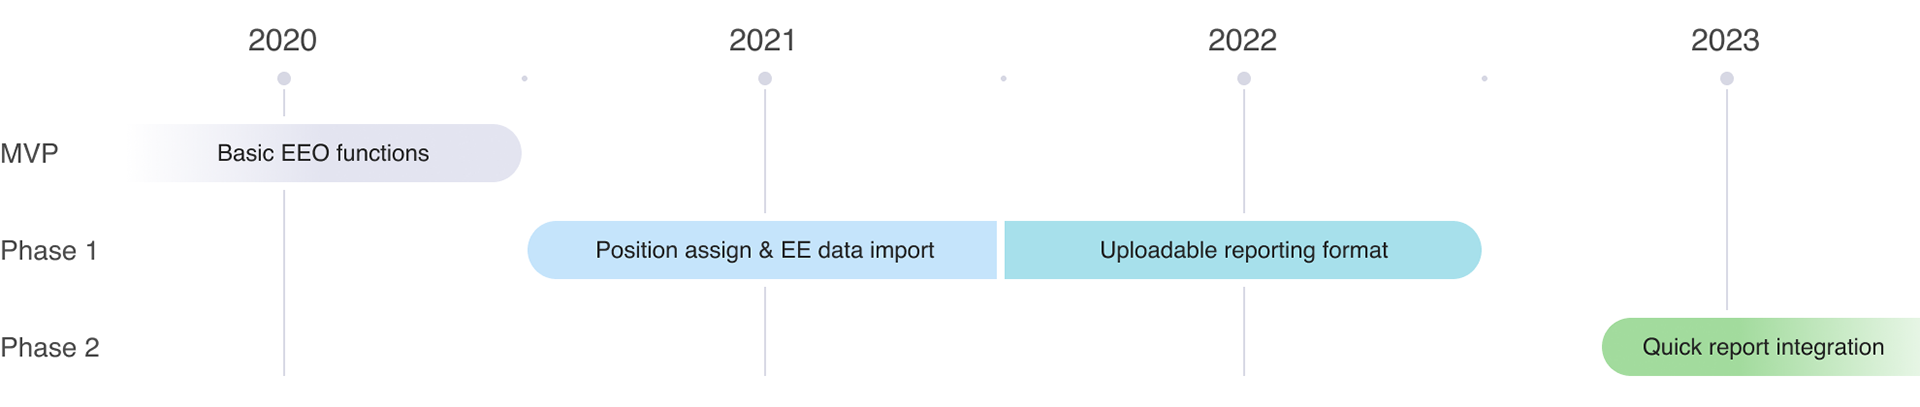
Phase 2: Flow improvement
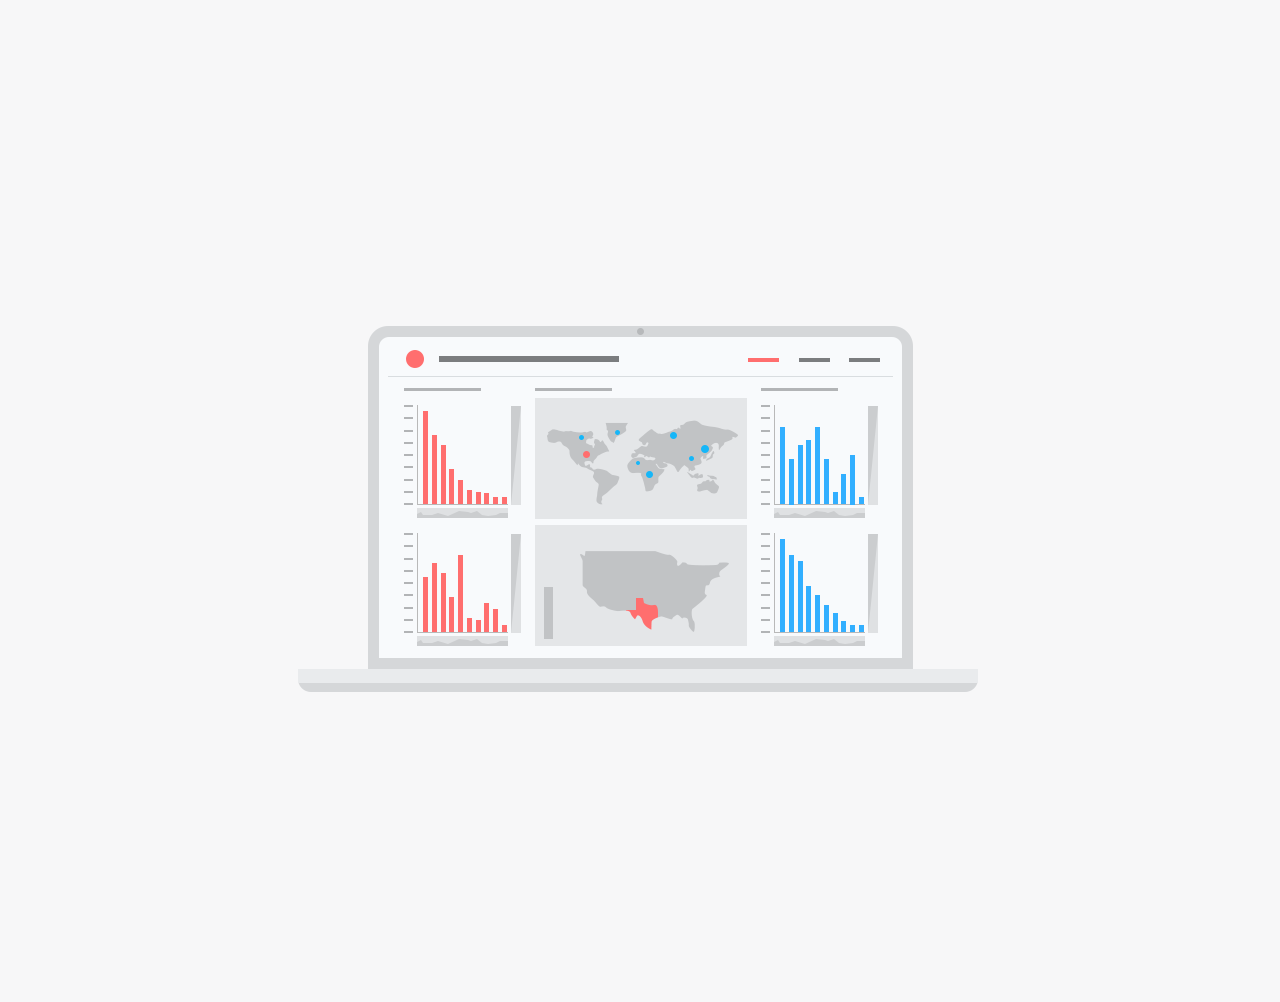
Building on feedback from testing, we discovered that most participants mistakenly assumed that EEO reporting assistance was a part of another product "Analytics & Reports" on the dashboard, which caused significant issues with findability. In response, during this phase, I thoughtfully contemplated how to integrate across features and designed an intuitive flow.
Building on feedback from testing, we discovered that most participants mistakenly assumed that EEO reporting assistance was a part of another product "Analytics & Reports" on the dashboard, which caused significant issues with findability. In response, during this phase, I thoughtfully contemplated how to integrate across features and designed an intuitive flow.
Improved features
As mentioned above, we added three powerful abilities in this phase. In the new design, users can enter a data importing view and bring their local data to Flex quickly and correctly. I collaborate more on this with the dev team since there're various error-preventing messages to consider so that whatever mistake users make can be found and notified before saving.
In the Prepare for reporting card, we added a capability to batch assigning positions so that the users won't need to assign them individually. We also cooperated with our content team to add a help article explaining the EEO-1 job category, so users can be less confused if they have never done this.
Nevertheless, we made the uploadable EEO-1 data file come true. After users generate an EEO-1 report, they can choose to download the uploadable format in the list and get it done by filling out some extra information.
Similarly, we tested 25 participants in total for the new version. Although it was encouraging to see most of them complete the tasks with little support, we also received feedback that some of the wording we used needed clearer explanations, and some users got lost when navigating to the next step. With this feedback, I began formulating the vision for the next phase.
Improved flow
This phase focuses on improving the workflow of EEO-1 report generation. We discovered that some users struggled to find the EEO reporting feature on the dashboard and got lost during the process. To solve this issue, I collaborated with our Analytics & Report product team and integrate a new consistent experience. In the following Figma prototype, you may imagine you're an HR admin going to create an EEO-1 report and try to interact with it.
We are all excited about this solution, and again we tested it out with 7 participants. Although there was still some confusion around the tabs "Sets" and "All reports" in the Quick reports drawer, and a large number of available reports making it hard to find EEO-1 reports without using the search bar, still, 7 of 7 participants like the UX and said they appreciate the information fixing without navigating outside of the workflow. Finally, I think we made it a good experience with proven observations.
Summary
This project has been running for over three years, and all these words and images I can present here are a small part of all design outcomes, not to mention the work that had been done by the Product and Dev teams. Each screen that I can proudly embed was walked through numerous discussions and thousands of meetings. The EEO is definitely a giant beast that I can't beat by myself, and I really want to say thanks to every single person that was involved in this project and contributed to it.